
According to UNESCO Science Report towards 2030, Sri
lanka with 41% ranks highest in terms of women representation in Science
followed by Pakistan with 36% and India with 15%.
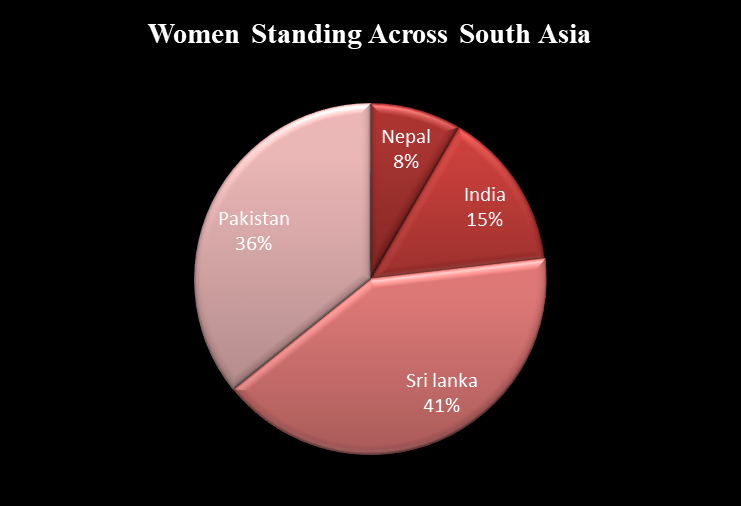
Women
Standing across South Asia
Source:
UNESCO Science Report towards 2030, 2015)
According
to the UNESCO Institute for Statistics Report, March 2017, the discipline-wise
breakdown of female researchers in Pakistan suggests that highest percentage of
female researchers are engaged in medical and health sciences with 48.31%,
followed by humanities and arts with 45.5% and natural sciences with 42.7%.
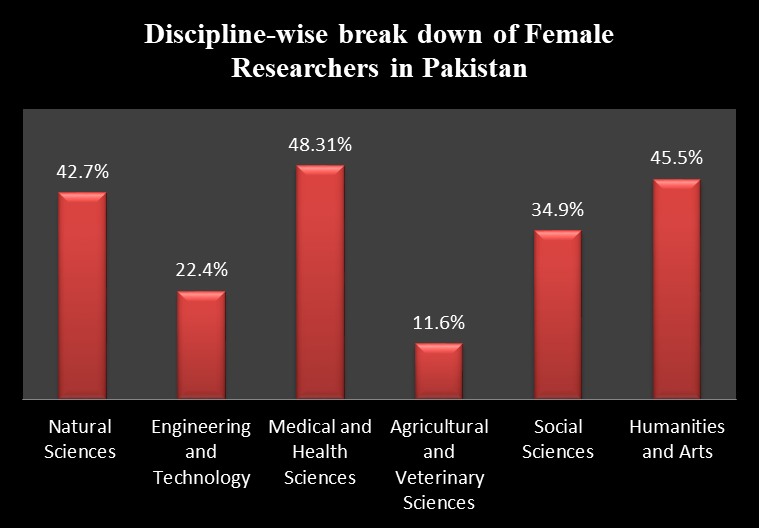
Discipline-wise
Breakdown of Female Researchers in Pakistan
Source: UNESCO Institute for Statistics
Report, March 2017
The highest number of female PhD scholars are enrolled
in natural sciences followed by social sciences
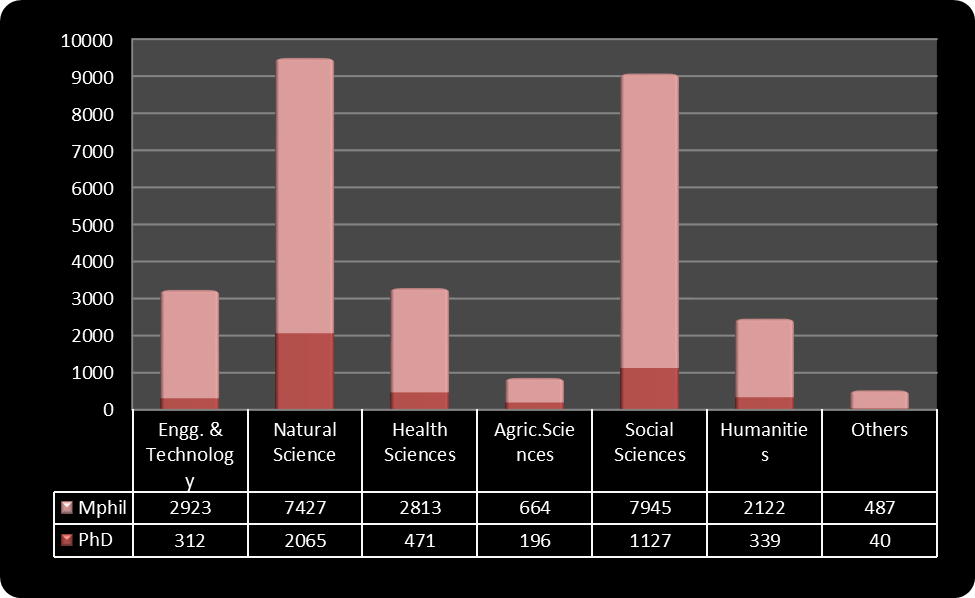
Number
of female PhD and MPhil students currently enrolled in Pakistani HEIs
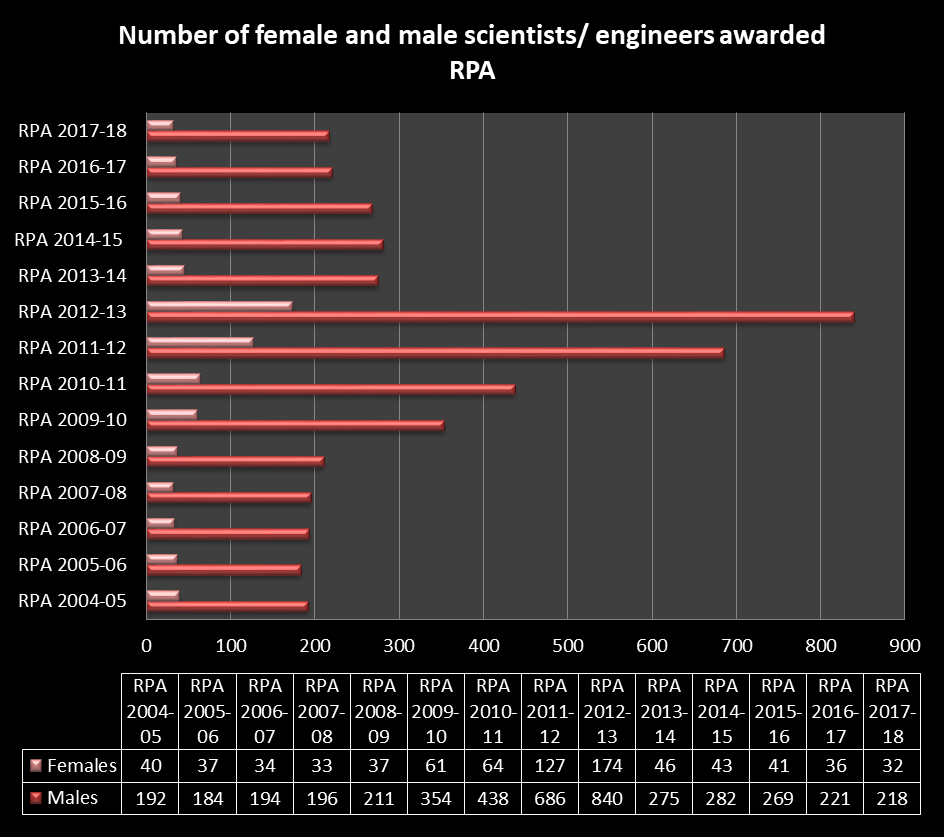
Number of female and males scientists/ engineers,
awarded RPA from 2004-05 to 2017-18 Source: Pakistan Council for Science and Technology
The Table below shows the
discipline-wise award of RPA to female scientists/engineers from 2004-05 to
2017-18. According to the data from PCST it is evident that the highest number
of female scientists awarded with RPA belong to Biological Sciences and
Chemistry
Year
|
Agri
|
Bio
|
Chem
|
Earth
Sci
|
Eng
|
Math
|
Pharm
|
Phys
|
Comp
|
Stat
|
Health
|
Envi.
Sci.
|
2004-05
|
2
|
13
|
20
|
0
|
0
|
0
|
1
|
4
|
0
|
0
|
0
|
0
|
2005-06
|
0
|
12
|
21
|
0
|
0
|
0
|
1
|
2
|
0
|
0
|
1
|
0
|
2006-07
|
0
|
11
|
19
|
0
|
0
|
0
|
1
|
2
|
0
|
0
|
1
|
0
|
2007-08
|
0
|
10
|
18
|
0
|
0
|
0
|
2
|
3
|
0
|
0
|
0
|
0
|
2008-09
|
1
|
9
|
20
|
0
|
0
|
1
|
1
|
4
|
0
|
0
|
1
|
0
|
2009-10
|
3
|
18
|
28
|
0
|
1
|
1
|
4
|
7
|
0
|
0
|
0
|
0
|
2010-11
|
0
|
18
|
33
|
1
|
1
|
2
|
2
|
5
|
1
|
0
|
0
|
1
|
2011-12
|
3
|
44
|
59
|
0
|
0
|
6
|
3
|
10
|
0
|
0
|
0
|
2
|
2012-13
|
11
|
64
|
68
|
0
|
0
|
8
|
3
|
12
|
0
|
0
|
3
|
4
|
2013-14
|
0
|
22
|
15
|
0
|
0
|
3
|
0
|
3
|
0
|
0
|
2
|
1
|
2014-15
|
0
|
19
|
18
|
0
|
0
|
2
|
1
|
1
|
0
|
0
|
0
|
2
|
2015-16
|
0
|
16
|
13
|
0
|
0
|
5
|
2
|
3
|
0
|
0
|
0
|
2
|
2016-17
|
1
|
15
|
11
|
0
|
0
|
4
|
1
|
3
|
0
|
0
|
0
|
1
|
2017-18
|
0
|
17
|
6
|
0
|
1
|
1
|
1
|
2
|
0
|
0
|
2
|
2
|
Discipline-wise
Award of RPA to Female Scientists/ Engineers from 2004-05 to 2017-18
Source: Pakistan Council
for Science and Technology
The
graph below shows the cumulative impact factor and citations of male and female
scientists registered for RPA during 2014, 2015 and 2016
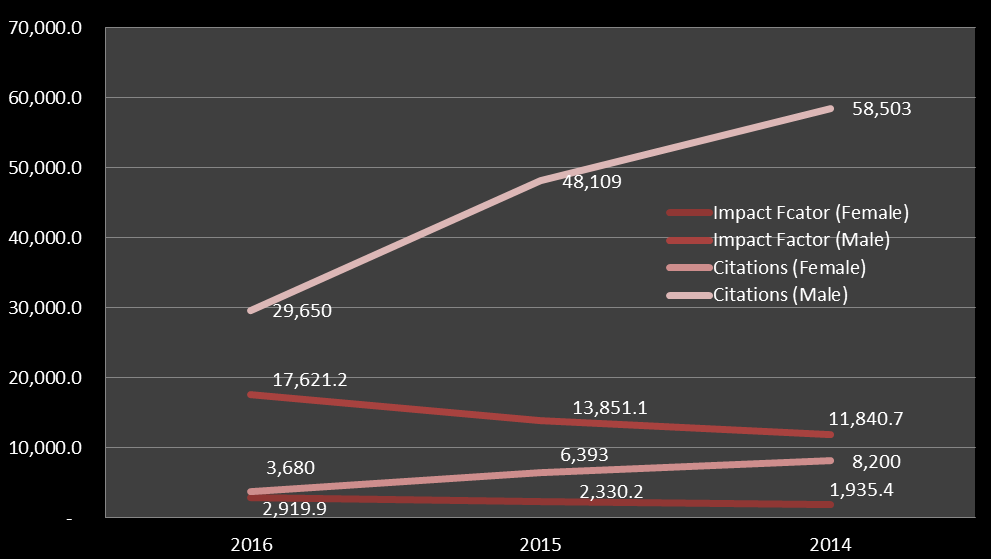
Cumulative
Impact Factor and Citations of scientists registered for RPA
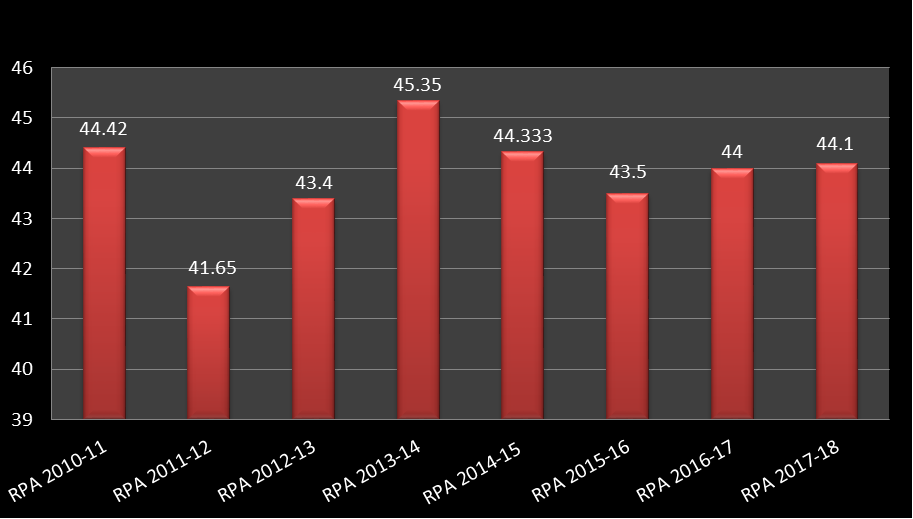
Average
age wise Award of RPA to female scientists/engineers in last 7 years
The Figure below provides a comparative overview of
the patents granted to male and female researchers during 2006-2015. The
highest number of patents granted to female researchers was during 2011
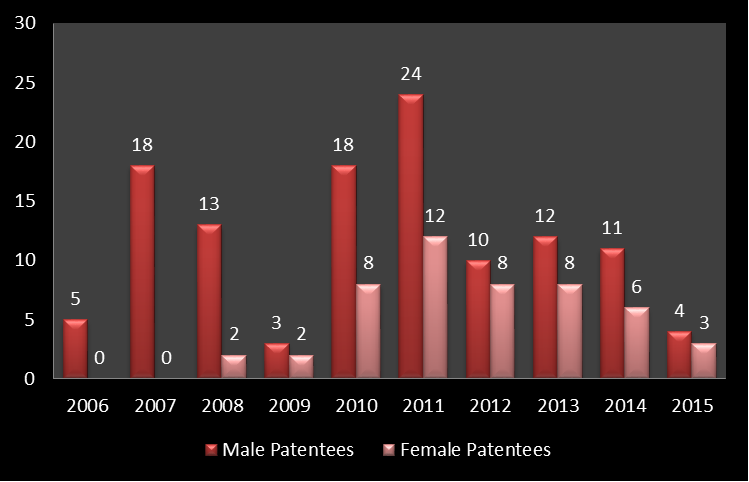
Patents granted to female researchers in comparison to
men during the period 2006-2015